
Hi, I’m Kavya Sharma 👋
Hi, I’m Kavya Sharma 👋
Hi, I’m Kavya Sharma 👋
AI & Data Analyst | Machine Learning Enthusiast
AI & Data Analyst | Machine Learning Enthusiast
AI & Data Analyst | Machine Learning Enthusiast
ABOUT ME
ABOUT ME
ABOUT ME
Hi, I'm Kavya Sharma 👋 — an AI & Data Analyst passionate about turning data into actionable insights and intelligent solutions.
My experience spans Machine Learning, NLP, Generative AI, and Business Analytics, where I've built predictive models, AI-powered dashboards, and LLM-enabled applications using Python, SQL, Scikit-learn, Streamlit, and LangChain.
I enjoy combining data, analytics, and AI to solve real-world challenges and create solutions that are not only technically strong but also meaningful and impactful.
Hi, I'm Kavya Sharma 👋 — an AI & Data Analyst passionate about turning data into actionable insights and intelligent solutions.
My experience spans Machine Learning, NLP, Generative AI, and Business Analytics, where I've built predictive models, AI-powered dashboards, and LLM-enabled applications using Python, SQL, Scikit-learn, Streamlit, and LangChain.
I enjoy combining data, analytics, and AI to solve real-world challenges and create solutions that are not only technically strong but also meaningful and impactful.
EDUCATION & EXPERIENCE
EDUCATION & EXPERIENCE
EDUCATION & EXPERIENCE
Master of Computer Applications (MCA)
Master of Computer Applications (MCA)
Master of Computer Applications (MCA)
Sunderdeep Global University, Ghaziabad
Sunderdeep Global University, Ghaziabad
Sunderdeep Global University, Ghaziabad
2024-2026
2024-2026
Bachelor of Computer Applications (BCA)
Bachelor of Computer Applications (BCA)
Bachelor of Computer Applications (BCA)
SC Guria Institute of Management and Technology, Kashipur
SC Guria Institute of Management and Technology, Kashipur
SC Guria Institute of Management and Technology, Kashipur
2021-2024
2021-2024
Growth & Strategy Intern (Team Lead)
Growth & Strategy Intern (Team Lead)
Growth & Strategy Intern (Team Lead)
Ever Lasting Fabric | California, Remote
Ever Lasting Fabric | California, Remote
Ever Lasting Fabric | California, Remote
Oct 2025 – Apr 2026
Oct 2025 – Apr 2026
Conducted customer behavior analysis, market research, and competitor studies to identify growth opportunities and support strategic business decisions. Developed data-driven reports and insights while collaborating on remote business initiatives. Recognized as a Team Lead during the internship, contributing to project coordination, reporting, and the successful execution of team deliverables.
Conducted customer behavior analysis, market research, and competitor studies to identify growth opportunities and support strategic business decisions. Developed data-driven reports and insights while collaborating on remote business initiatives. Recognized as a Team Lead during the internship, contributing to project coordination, reporting, and the successful execution of team deliverables.
Conducted customer behavior analysis, market research, and competitor studies to identify growth opportunities and support strategic business decisions. Developed data-driven reports and insights while collaborating on remote business initiatives. Recognized as a Team Lead during the internship, contributing to project coordination, reporting, and the successful execution of team deliverables.
Key Skills



AI & Data Science Toolkit
AI & Data Science Toolkit
AI & Data Science Toolkit
Technologies I use for Analytics, Machine Learning & AI
Technologies I use for Analytics, Machine Learning & AI
Technologies I use for Analytics, Machine Learning & AI
Programming & Databases
Programming & Databases
Programming & Databases

Python
Python
Python

PostgreSql
PostgreSql
PostgreSql
Analytics & Visualization
Analytics & Visualization
Analytics & Visualization

Pandas
Pandas
Pandas

NumPy
NumPy
NumPy

Excel
Excel
Excel
Power BI
Power BI
Power BI
Plotly
Plotly
Plotly
Machine Learning
Machine Learning
Machine Learning

Scikit-learn
Scikit-learn
Scikit-learn
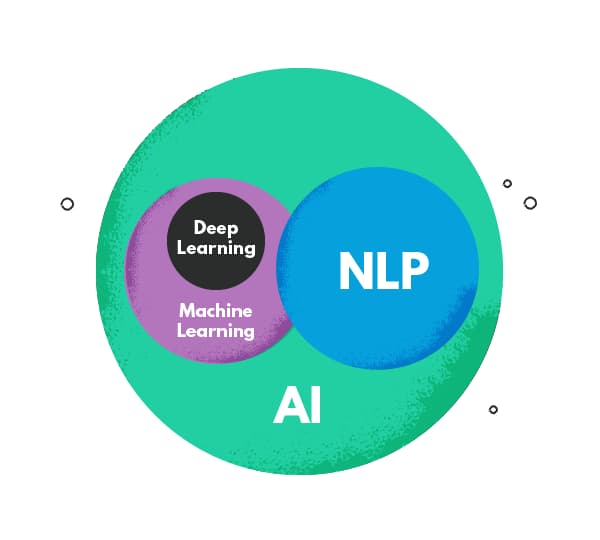
NLP
NLP

Random Forest
Random Forest
Random Forest

XGBoost
XGBoost
XGBoost
NLP
NLP
AI & Development Tools
AI & Development Tools
AI & Development Tools

LangChain
LangChain
LangChain

Streamlit
Streamlit
Streamlit

Groq LLaMA
Groq LLaMA
Groq LLaMA

Git
Git
Git

Github
Github
Github
PROJECTS
PROJECTS
PROJECTS
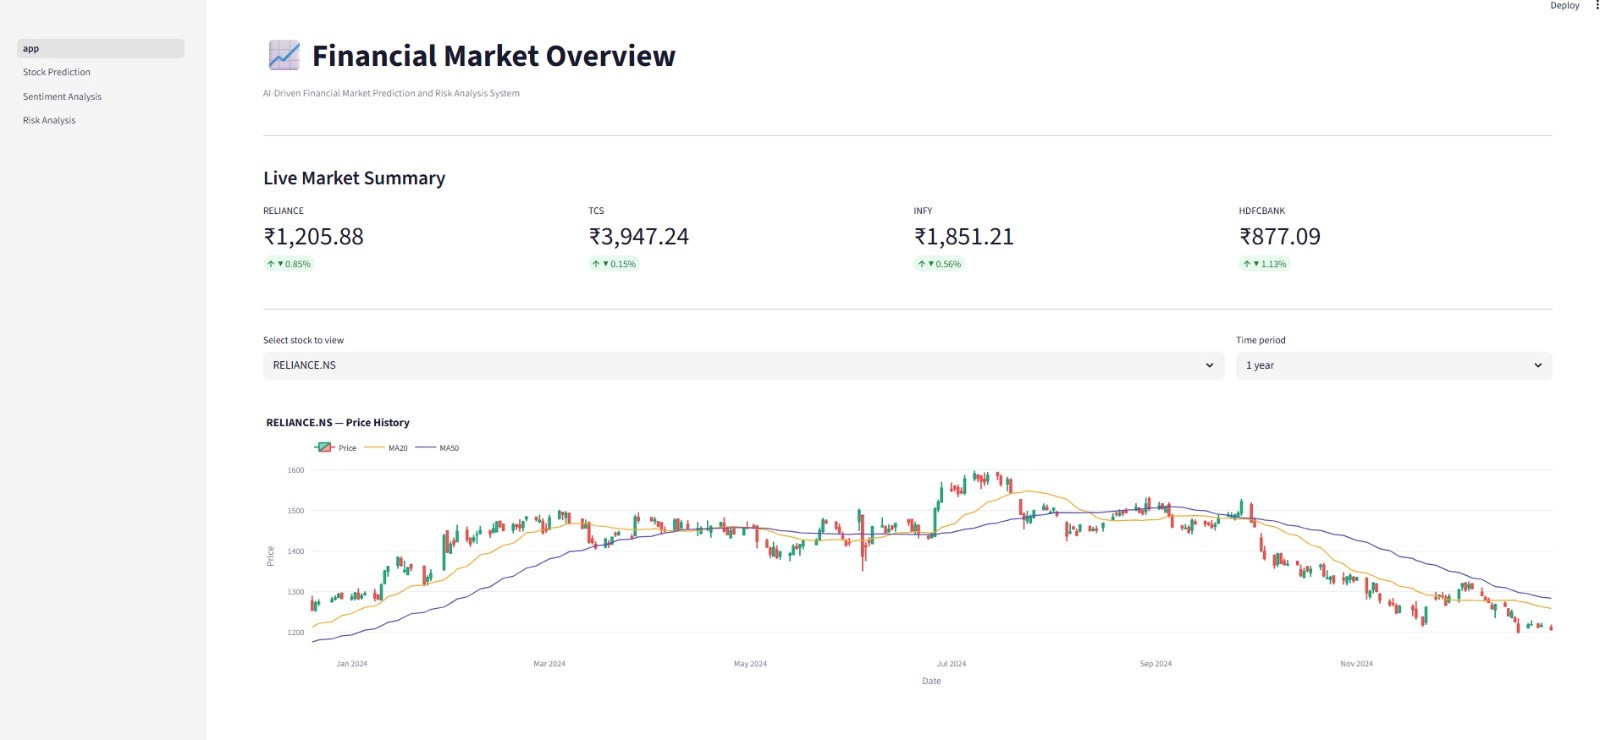
AI-Driven Financial Market Prediction & Risk Analysis System
AI-Driven Financial Market Prediction & Risk Analysis System
AI-Driven Financial Market Prediction & Risk Analysis System
Tools: Python, Streamlit, LSTM, Random Forest, VADER NLP, yFinance, Plotly, Scikit-learn
Description: Built an AI-powered financial analytics platform that predicts stock market trends and evaluates investment risk using machine learning and sentiment analysis.
Key Highlights:
Developed forecasting models using LSTM and Random Forest algorithms.
Performed sentiment analysis on financial news using VADER NLP.
Calculated investment metrics such as Volatility, Sharpe Ratio, and Value at Risk (VaR).
Created interactive visualizations and dashboards with Plotly and Streamlit.
Impact: Enabled data-driven investment analysis by combining predictive modeling, risk assessment, and market sentiment insights into a single platform.
Tools: Python, Streamlit, LSTM, Random Forest, VADER NLP, yFinance, Plotly, Scikit-learn
Description: Built an AI-powered financial analytics platform that predicts stock market trends and evaluates investment risk using machine learning and sentiment analysis.
Key Highlights:
Developed forecasting models using LSTM and Random Forest algorithms.
Performed sentiment analysis on financial news using VADER NLP.
Calculated investment metrics such as Volatility, Sharpe Ratio, and Value at Risk (VaR).
Created interactive visualizations and dashboards with Plotly and Streamlit.
Impact: Enabled data-driven investment analysis by combining predictive modeling, risk assessment, and market sentiment insights into a single platform.
Tools: Python, Streamlit, LSTM, Random Forest, VADER NLP, yFinance, Plotly, Scikit-learn
Description: Built an AI-powered financial analytics platform that predicts stock market trends and evaluates investment risk using machine learning and sentiment analysis.
Key Highlights:
Developed forecasting models using LSTM and Random Forest algorithms.
Performed sentiment analysis on financial news using VADER NLP.
Calculated investment metrics such as Volatility, Sharpe Ratio, and Value at Risk (VaR).
Created interactive visualizations and dashboards with Plotly and Streamlit.
Impact: Enabled data-driven investment analysis by combining predictive modeling, risk assessment, and market sentiment insights into a single platform.
Tool: Python, Streamlit, LangChain, Groq LLaMA 3, Plotly, Pandas, Scikit-learn
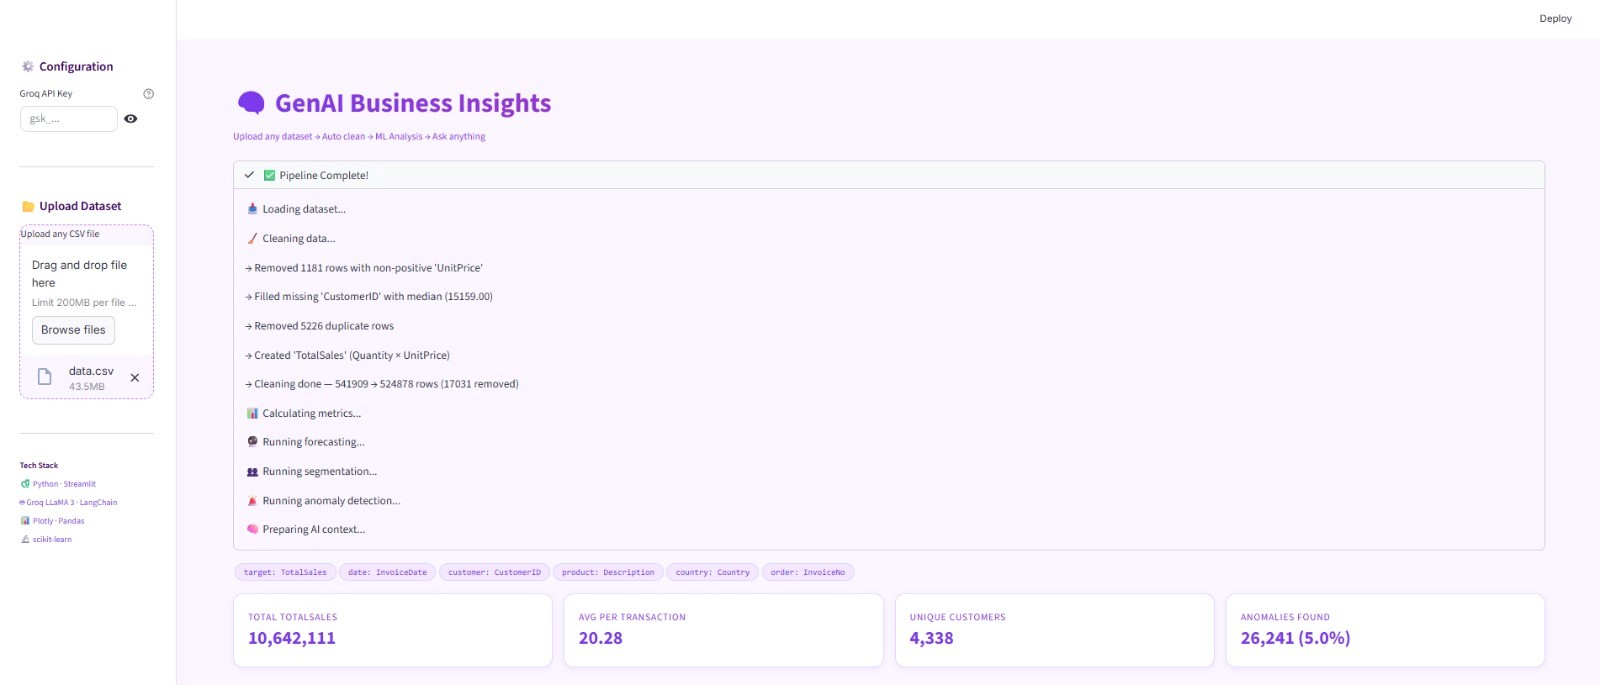
Description: Developed a GenAI-powered business analytics platform that automates data analysis and enables users to interact with datasets using natural language.
Key Highlights:
Automated data cleaning, forecasting, customer segmentation, and anomaly detection.
Integrated LangChain and Groq LLaMA 3 to support AI-driven dataset querying.
Generated business reports and actionable insights using LLM-powered workflows.
Built interactive dashboards for analytics and decision-making.
Impact: Transformed raw business data into meaningful insights, helping users explore datasets, identify trends, and make informed decisions through AI-assisted analytics.
Tool: Python, Streamlit, LangChain, Groq LLaMA 3, Plotly, Pandas, Scikit-learn
Description: Developed a GenAI-powered business analytics platform that automates data analysis and enables users to interact with datasets using natural language.
Key Highlights:
Automated data cleaning, forecasting, customer segmentation, and anomaly detection.
Integrated LangChain and Groq LLaMA 3 to support AI-driven dataset querying.
Generated business reports and actionable insights using LLM-powered workflows.
Built interactive dashboards for analytics and decision-making.
Impact: Transformed raw business data into meaningful insights, helping users explore datasets, identify trends, and make informed decisions through AI-assisted analytics.
Tool: Python, Streamlit, LangChain, Groq LLaMA 3, Plotly, Pandas, Scikit-learn
Description: Developed a GenAI-powered business analytics platform that automates data analysis and enables users to interact with datasets using natural language.
Key Highlights:
Automated data cleaning, forecasting, customer segmentation, and anomaly detection.
Integrated LangChain and Groq LLaMA 3 to support AI-driven dataset querying.
Generated business reports and actionable insights using LLM-powered workflows.
Built interactive dashboards for analytics and decision-making.
Impact: Transformed raw business data into meaningful insights, helping users explore datasets, identify trends, and make informed decisions through AI-assisted analytics.
Customer Churn Prediction
Customer Churn Prediction
Description: This project focuses on predicting customer churn — identifying whether a customer is likely to leave the company or continue using its services. By analyzing customer demographics, account details, and service usage patterns, the project delivers actionable insights that can help businesses improve retention strategies.
Tools & Techniques:
Programming & Analysis: Python, Pandas, NumPy, Matplotlib, Seaborn.
Machine Learning Models Tested: Logistic Regression, Random Forest, XGBoost.
Model Evaluation: Train-Test Split, Accuracy Score, Confusion Matrix, Classification Report.
Prediction Outcome: The best-performing model, Random Forest, provided the highest accuracy of ~82% in predicting churn.
1 (Yes): Customer likely to churn
0 (No): Customer likely to stay
This precise prediction outcome makes the project valuable for businesses seeking to identify at-risk customers and take proactive measures.
Description: This project focuses on predicting customer churn — identifying whether a customer is likely to leave the company or continue using its services. By analyzing customer demographics, account details, and service usage patterns, the project delivers actionable insights that can help businesses improve retention strategies.
Tools & Techniques:
Programming & Analysis: Python, Pandas, NumPy, Matplotlib, Seaborn.
Machine Learning Models Tested: Logistic Regression, Random Forest, XGBoost.
Model Evaluation: Train-Test Split, Accuracy Score, Confusion Matrix, Classification Report.
Prediction Outcome: The best-performing model, Random Forest, provided the highest accuracy of ~82% in predicting churn.
1 (Yes): Customer likely to churn
0 (No): Customer likely to stay
This precise prediction outcome makes the project valuable for businesses seeking to identify at-risk customers and take proactive measures.
Description: This project focuses on predicting customer churn — identifying whether a customer is likely to leave the company or continue using its services. By analyzing customer demographics, account details, and service usage patterns, the project delivers actionable insights that can help businesses improve retention strategies.
Tools & Techniques:
Programming & Analysis: Python, Pandas, NumPy, Matplotlib, Seaborn.
Machine Learning Models Tested: Logistic Regression, Random Forest, XGBoost.
Model Evaluation: Train-Test Split, Accuracy Score, Confusion Matrix, Classification Report.
Prediction Outcome: The best-performing model, Random Forest, provided the highest accuracy of ~82% in predicting churn.
1 (Yes): Customer likely to churn
0 (No): Customer likely to stay
This precise prediction outcome makes the project valuable for businesses seeking to identify at-risk customers and take proactive measures.


Tool: Power BI
Type: Live Interactive Dashboard
Description: Developed an end-to-end sales analytics and forecasting dashboard using Power BI to track, analyze, and forecast Superstore sales across multiple dimensions. This project combines real-time performance tracking with predictive insights to support strategic sales planning.
Key Features & Contributions:
Cleaned and transformed raw sales data for accurate reporting and analysis.
Visualized KPIs including total sales, profit, orders, shipping days, and payment modes across regions and segments.
Analyzed regional and state-wise performance to uncover high-revenue locations and untapped markets.
Identified seasonal sales trends, monthly growth, and key drivers by segment and sub-category.
Implemented time series forecasting using Power BI’s analytics tools to project 15-day future sales.
Impact: Enabled data-backed sales decisions by revealing demand patterns, optimizing regional performance, and forecasting future sales to improve planning accuracy.
Tool: Power BI
Type: Live Interactive Dashboard
Description: Developed an end-to-end sales analytics and forecasting dashboard using Power BI to track, analyze, and forecast Superstore sales across multiple dimensions. This project combines real-time performance tracking with predictive insights to support strategic sales planning.
Key Features & Contributions:
Cleaned and transformed raw sales data for accurate reporting and analysis.
Visualized KPIs including total sales, profit, orders, shipping days, and payment modes across regions and segments.
Analyzed regional and state-wise performance to uncover high-revenue locations and untapped markets.
Identified seasonal sales trends, monthly growth, and key drivers by segment and sub-category.
Implemented time series forecasting using Power BI’s analytics tools to project 15-day future sales.
Impact: Enabled data-backed sales decisions by revealing demand patterns, optimizing regional performance, and forecasting future sales to improve planning accuracy.
Tool: Power BI
Type: Live Interactive Dashboard
Description: Developed an end-to-end sales analytics and forecasting dashboard using Power BI to track, analyze, and forecast Superstore sales across multiple dimensions. This project combines real-time performance tracking with predictive insights to support strategic sales planning.
Key Features & Contributions:
Cleaned and transformed raw sales data for accurate reporting and analysis.
Visualized KPIs including total sales, profit, orders, shipping days, and payment modes across regions and segments.
Analyzed regional and state-wise performance to uncover high-revenue locations and untapped markets.
Identified seasonal sales trends, monthly growth, and key drivers by segment and sub-category.
Implemented time series forecasting using Power BI’s analytics tools to project 15-day future sales.
Impact: Enabled data-backed sales decisions by revealing demand patterns, optimizing regional performance, and forecasting future sales to improve planning accuracy.
Housing Price Prediction
Housing Price Prediction
Housing Price Prediction
Tools: Python, Pandas, NumPy, Matplotlib, Seaborn, Scikit-learn
Description: Built a regression model to predict California housing prices using demographic and geographic features.
Techniques:
Performed EDA with visualizations & correlation heatmaps.
Selected key features based on correlation analysis.
Trained and evaluated Linear Regression & Random Forest models.
Compared results using MAE, RMSE, and R² Score.
Visualized Actual vs Predicted prices & analyzed feature importance.
Outcome: Random Forest achieved R² ~0.81, outperforming Linear Regression and providing actionable insights into key price drivers.
Tools: Python, Pandas, NumPy, Matplotlib, Seaborn, Scikit-learn
Description: Built a regression model to predict California housing prices using demographic and geographic features.
Techniques:
Performed EDA with visualizations & correlation heatmaps.
Selected key features based on correlation analysis.
Trained and evaluated Linear Regression & Random Forest models.
Compared results using MAE, RMSE, and R² Score.
Visualized Actual vs Predicted prices & analyzed feature importance.
Outcome: Random Forest achieved R² ~0.81, outperforming Linear Regression and providing actionable insights into key price drivers.
Tools: Python, Pandas, NumPy, Matplotlib, Seaborn, Scikit-learn
Description: Built a regression model to predict California housing prices using demographic and geographic features.
Techniques:
Performed EDA with visualizations & correlation heatmaps.
Selected key features based on correlation analysis.
Trained and evaluated Linear Regression & Random Forest models.
Compared results using MAE, RMSE, and R² Score.
Visualized Actual vs Predicted prices & analyzed feature importance.
Outcome: Random Forest achieved R² ~0.81, outperforming Linear Regression and providing actionable insights into key price drivers.


Tool: Power BI
Type: Live Interactive Dashboard
Description: Designed and developed a dynamic HR Analytics Dashboard to uncover key workforce trends and support strategic decision-making in HR. The dashboard focuses on employee attrition, salary distribution, tenure, and demographic breakdowns, enabling data-driven insights for retention and hiring strategies.
Key Highlights:
Analyzed attrition patterns across age, gender, education, job roles, and salary bands.
Queried and transformed HR data to create meaningful visualizations and KPIs.
Visualized metrics like attrition rate (20.6%), average salary, tenure, and job role distribution using Power BI.
Empowered HR teams with actionable insights to improve employee engagement and reduce turnover.
Impact: Helped stakeholders understand attrition drivers, identify high-risk segments, and shape more effective talent retention strategies.
Tool: Power BI
Type: Live Interactive Dashboard
Description: Designed and developed a dynamic HR Analytics Dashboard to uncover key workforce trends and support strategic decision-making in HR. The dashboard focuses on employee attrition, salary distribution, tenure, and demographic breakdowns, enabling data-driven insights for retention and hiring strategies.
Key Highlights:
Analyzed attrition patterns across age, gender, education, job roles, and salary bands.
Queried and transformed HR data to create meaningful visualizations and KPIs.
Visualized metrics like attrition rate (20.6%), average salary, tenure, and job role distribution using Power BI.
Empowered HR teams with actionable insights to improve employee engagement and reduce turnover.
Impact: Helped stakeholders understand attrition drivers, identify high-risk segments, and shape more effective talent retention strategies.
Tool: Power BI
Type: Live Interactive Dashboard
Description: Designed and developed a dynamic HR Analytics Dashboard to uncover key workforce trends and support strategic decision-making in HR. The dashboard focuses on employee attrition, salary distribution, tenure, and demographic breakdowns, enabling data-driven insights for retention and hiring strategies.
Key Highlights:
Analyzed attrition patterns across age, gender, education, job roles, and salary bands.
Queried and transformed HR data to create meaningful visualizations and KPIs.
Visualized metrics like attrition rate (20.6%), average salary, tenure, and job role distribution using Power BI.
Empowered HR teams with actionable insights to improve employee engagement and reduce turnover.
Impact: Helped stakeholders understand attrition drivers, identify high-risk segments, and shape more effective talent retention strategies.
Let’s Connect
Let’s Connect
Let’s Connect

